
Schematic changelog
Credit Balance Over Time
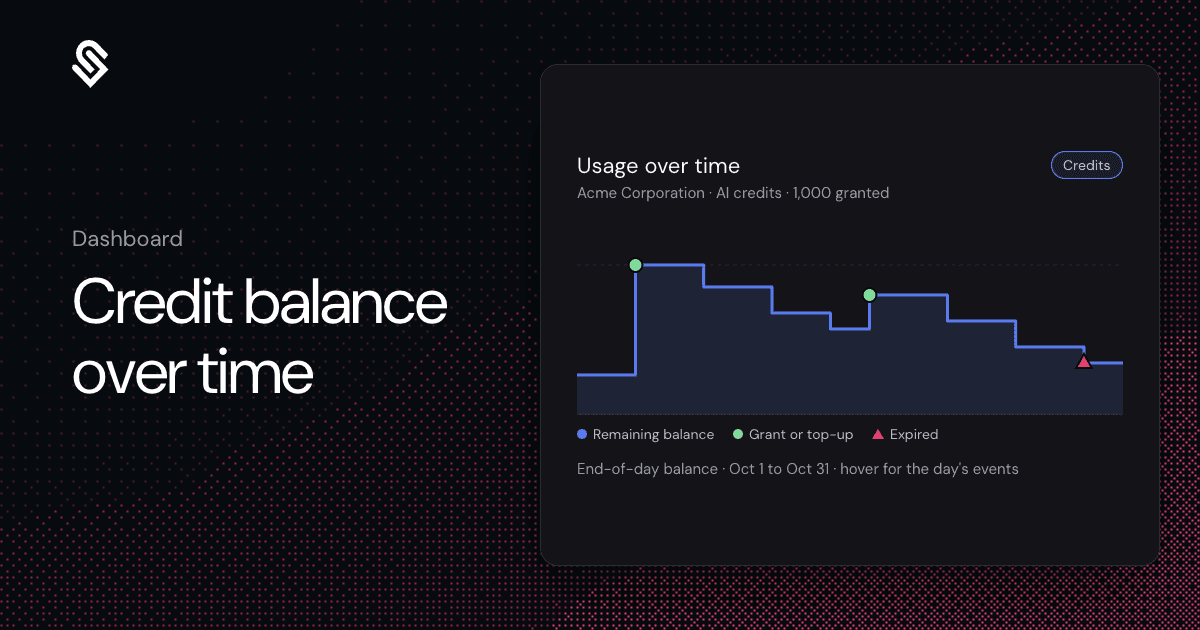
You could see a company's credit balance today and a list of ledger rows, but not how the balance moved across the period.
The usage graph on the company profile is now Usage Over Time. It still plots a feature, and now it plots a credit too. Pick a credit and it draws the end-of-day balance as a step line, with markers where credits arrived (a plan grant, a top-up or a bundle) and where they expired. Hover a day to see its balance, its events and its usage per feature.
When a customer asks where their credits went, find the day the balance dropped and check which features drew it down.
Docs: Credit burndown
Live now for every account.